Chainage
Overview
The chainage tab contains information relevant to the various chainages to be shown on the chart. Negative chainages are permitted.
If any field is left blank or with it's default value then when the chart is viewed or printed any necessary values will be automatically filled.
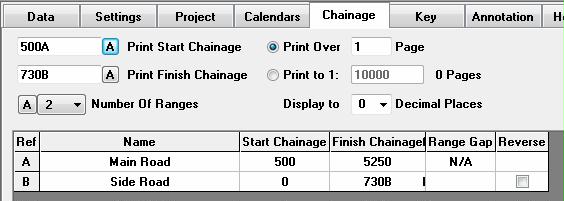
Print Start Chainage
This sets the 1st chainage printed on the chart. If left blank it is automatically filled with the lowest chainage of the any activity on the chart. Pressing the 'A' button automatically fills the field with the lowest chainage of the any activity on the chart.
Print Finish Chainage
This sets the last chainage printed on the chart. If left blank it is automatically filled with the highest chainage of any activity on the chart. Pressing the 'A' button automatically fills the field with the highest chainage of any activity on the chart.
Print Over x Pages
This permits the chart to be printed over a series of pages rather than a single page. 1 page is the default setting.
Print to 1:x
This permits the chart to be printed to a specific metric scale. The scale assumes that 1 chainage unit is 1 meter. The number of pages this scale will print to is shown to the right. Note: this shows zero if insufficient information is available to calculate, viewing or previewing the chart will ensure that the number of pages shown is correct.
Decimal Places
The chainage decimal places field will set the decimal places of the chainage section of the chart but only if the intervals shown on the chart are less than 1.
Ranges
Frequently chainages on the chart are not continuous. E.g. the chart may need to a main road and a side road or sections of the scheme may have been developed at different times and there may be a 1000 north and a 1000 south.
Time location plus handles this problem by allocating chainage RANGES to chainages, by means of adding a suffix. 1000A is therefore a different chainage to 1000B. Suffixes A to ZZ are permissible permitting a total of 702 differing ranges. If no suffix is added to any chainage range A is assumed.
The maximum number of ranges to be used on the chart is set using the 'Number Of Ranges' drop down box. Pressing the adjacent 'A' button will scan the activity data and return the number of ranges.
Each range needs a start and finish chainage, and it can be given a name for displaying on the chart. If left blank then the lowest and highest chainage values of any activity in that range will be used as the start and finish chainage.
A gap can be shown between ranges to indicate a physical break. If the range gap field is left blank the range interval set on the settings tab will be used.

By default chainages run from Low Value to High Value, i.e. 1,2,3 etc if it is wished to show the chainage from High Value to Low Value, i.e. 3,2,1 etc then ticking 'Reverse' will show chainages for that individual range High to Low. (Note not available for the 1st range which must be Low to High). In the above example Range A is -200 to 400, Range B is 600 to 0 i.e. in reverse, Range C is 0 to 250 with a range gap of 100 between Range B & Range C
Copyright © 1998 - 2014, Naylor Computing